Data is just numbers until you make it speak—data visualization is the language that turns insights into action.
Table of Contents
We’ve all been there—staring at an endless spreadsheet, trying to make sense of numbers that seem to blur together. It feels overwhelming, right? That’s where data visualization comes in to save the day. Instead of wading through walls of text and numbers, you can turn data into something visual, like a chart or a graph, that clicks instantly.
Whether you’re an entrepreneur, a marketer, or someone who just loves uncovering stories in data, visualizing information can completely change how you see the world around you. Let’s dive into why data visualization is such a game-changer and how you can use it to your advantage.
What Exactly Is Data Visualization?
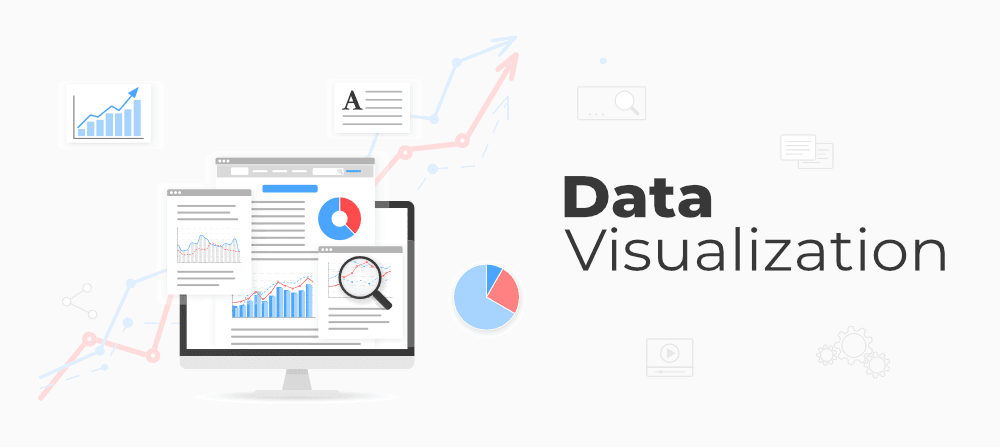
At its core, data visualization is about transforming raw data into images—charts, graphs, maps, or dashboards—that make the information easier to understand. Think of it as a bridge between cold, hard numbers and the human brain.
For example:
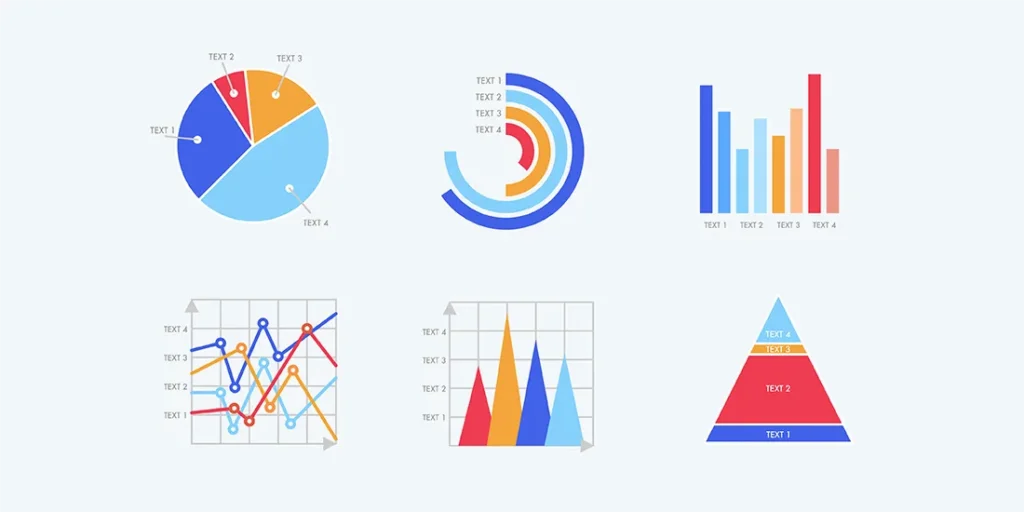
- A pie chart can instantly show which products make up most of your sales.
- A line graph reveals trends like seasonal spikes in website traffic.
- A heatmap highlights areas on a webpage that grab the most attention.
Instead of spending hours trying to decipher rows of numbers, a quick glance at a well-designed visual gives you the answers you need.
Why Does Data Visualization Matter?
Let’s be real: raw data can be intimidating. But visuals? They’re approachable, even fun. Here’s why data visualization is so important:
1. It Simplifies Complexity
We’ve all had moments when data feels overwhelming. Visuals cut through the noise, making even the most complicated datasets easier to digest.
Imagine trying to analyze months of sales data in a spreadsheet. Now picture a bar chart that clearly shows which months performed best. Easier, right?
Similarly, just like AI tools can simplify complex workflows—like managing overwhelming email inboxes—data visualization transforms endless rows of data into actionable insights. Discover how AI can take the stress out of email management and streamline your daily tasks.
2. It Helps You Make Smarter Decisions
Good decisions come from clear insights. Visualizing data highlights trends and outliers that might otherwise go unnoticed, giving you the confidence to act quickly.
3. It’s Easier to Share and Communicate
Have you ever tried explaining a complex idea to someone and watched their eyes glaze over? Visuals solve that problem. They grab attention and communicate your point without requiring a lengthy explanation.
4. It Uncovers Patterns You’d Miss
Sometimes the biggest insights are hiding in plain sight—if you know where to look. With data visualization, you can spot these patterns and turn them into opportunities.
5. It Gives You a Competitive Edge
In today’s fast-paced world, speed matters. The quicker you can understand and act on your data, the better. Visual tools help you stay ahead of the competition.
How Data Visualization Changes the Game
Every industry benefits from data visualization in unique ways. Here’s how it plays out in real life:
Marketing: Tracking Campaign Success
Marketers use tools like Google Analytics to visualize campaign performance. Instead of digging through reports, they can instantly see which channels drive the most traffic or conversions.
Finance: Managing Budgets
In finance, visual dashboards make it easier to track budgets, forecast revenue, or spot risks. For instance, a line graph showing monthly expenses could reveal unexpected cost spikes.
Healthcare: Saving Lives with Data
From tracking patient recovery rates to predicting disease outbreaks, data visualization has a real impact on healthcare decisions. COVID-19 dashboards, for example, were critical for policy planning during the pandemic.
Education: Personalizing Learning
Educators use visuals to track student progress and identify where extra support is needed. A heatmap, for instance, might show which quiz questions students struggled with the most.
What Makes a Great Data Visualization?
Not all visuals are created equal. A confusing or misleading graph can cause more harm than good. So, what separates the good from the bad?
Simplicity
Keep it clean and focused. Avoid cramming too much information into one chart.
Relevance
Your visual should answer a specific question. If it doesn’t help your audience make a decision, it’s unnecessary noise.
Accuracy
Trust is everything. Misleading scales or cherry-picked data can destroy credibility, so always ensure your visuals are truthful.
Accessibility
Make sure everyone can understand your visuals, including people with color blindness. Use accessible color schemes and add descriptive text when needed.
Interactivity
Want to take it up a notch? Interactive dashboards let users explore the data themselves. Think filters, zooms, or clickable elements that bring your data to life.
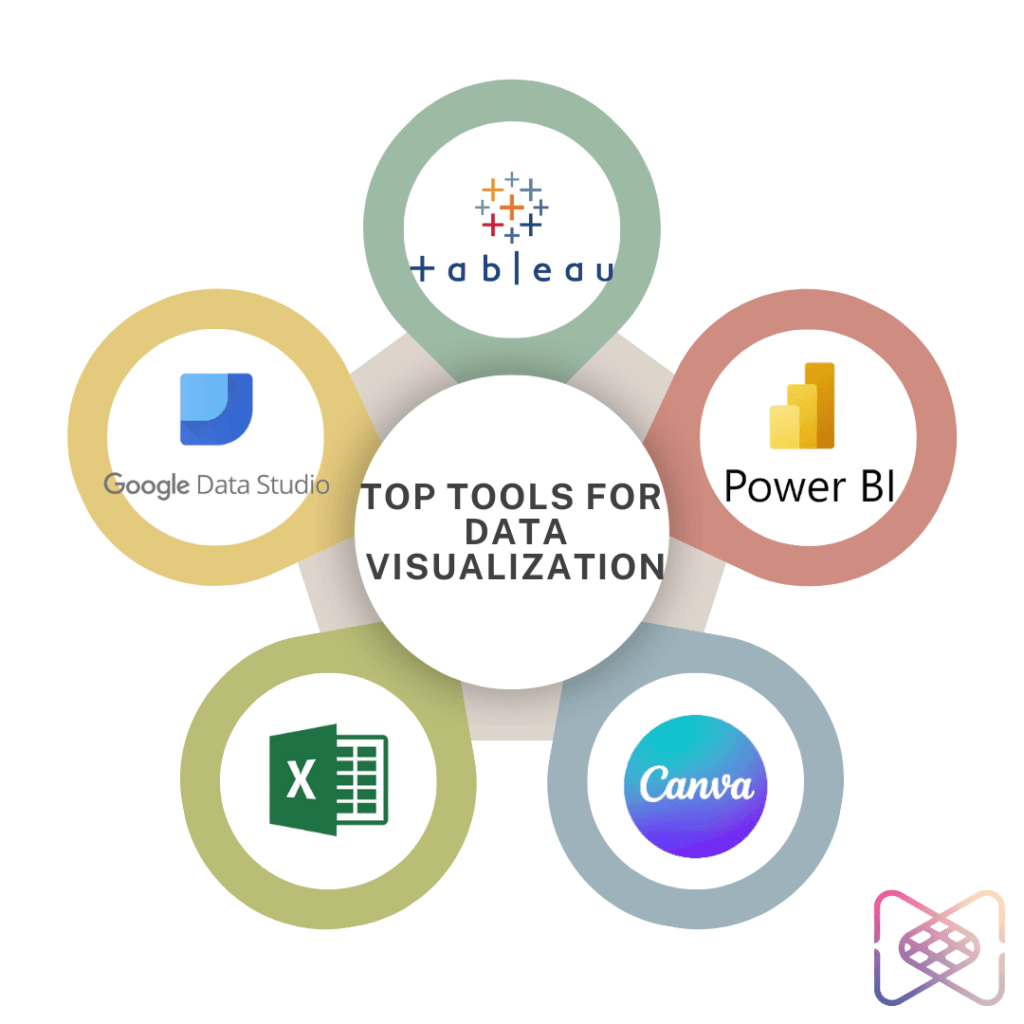
The Best Tools for Data Visualization
You don’t need to be a data scientist to get started with data visualization. Here are some popular tools to try:
- Tableau
This tool is perfect if you want advanced features and customizable dashboards. - Power BI
A favorite for businesses, Power BI integrates seamlessly with Microsoft products. - Google Data Studio
Ideal for marketers, this free tool connects to Google Analytics for easy reporting. - Excel
Yep, the classic spreadsheet software has plenty of chart options if you’re on a budget. - Canva
Not a traditional data tool, but Canva is great for designing simple infographics to share on social media. With the Flourish integration, Canva offers even more powerful options for creating interactive and engaging visuals.
How You Can Start Using Data Visualization Today
If you’re new to data visualization, start small:
- Pick a dataset you already use, like sales reports or website analytics.
- Choose a basic tool, like Google Data Studio or Excel, to create a visual.
- Ask yourself: “What story does this data tell?”
Over time, you’ll develop an eye for what works—and you’ll wonder how you ever managed without visuals.
Why MyceliumWeb Is Your Partner in Data Success
At MyceliumWeb, we know that data visualization is more than just charts and graphs—it’s about empowering you to make smarter, faster decisions. Our team specializes in building customized dashboards and tools that turn your raw data into actionable insights.
Whether you’re looking to streamline your marketing reports, optimize business operations, or uncover new growth opportunities, we’ve got your back. Let us help you bring your data to life.
By making your data visually engaging and easy to understand, you’re not just analyzing numbers—you’re uncovering stories that drive real impact. Let MyceliumWeb help you tell those stories.
